Photo by Markus Spiske on Unsplash
Background
FiMATS stands for Financial Markets Analysis and Tracking System. It is a R Shiny application that I developed during the Covid19 pandemic as I was stood-down (furloughed) in Apr-May 2020.
The objective of the app is to use statistics and machine learning to analyse the Financial markets. The data source for the prices is the Yahoo! Finance website. And I have used the tidyquant and quantmod packages to access the Yahoo! API.
The app is hosted on shinyapps.io/FiMATS and the entire source code is available in this github repo
Project Plan
- The first phase of the project was to build a MVP with some basic functionality. Following features are currently implemented :
- An overall market view, a view for the investments made by the user and a page for in-depth analysis
- The app also features live real-time stock prices that can be enabled/disabled as required
- The user can load a CSV file with the Yahoo! Finance stock codes he wants to track/analyse
- If the user has made any investments, the details of these can also be uploaded to the app
- In the following phases, I intend to implement the following
- Cloud integration, so that the user’s can save/read the data in a platform like Dropbox
- Stock price forecasting
- Identifying opportunities to invest
This blog post is meant to document some of the things I learnt in the process of developing this app.
Reactive Programming
In any software application that has a user interface, the user has to take certain actions and follow certain steps to get the desired output. In a traditional programming language, this is coded synchronously ie every input and its corresponding output has to be explicitly coded. But in a reactive programming language, all the inner workings of connecting the inputs to their outputs and their interdependencies are handled by the programming library. This not only results in a simpler application code but also enhances the user experience.
In Shiny, there are three types of reactives that can be loosely based on input-process-output (img source : RStudio)
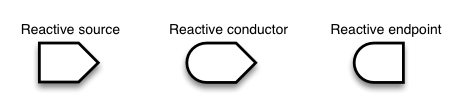
Reactive Source
- The
inputobjects are the examples of reactive source - They can also be created using
reactiveValandreactiveValuesfunctions - In the FiMATS app, I have used them for data storage
- The
DT_stats <- reactiveVal(readRDS(file=here::here("100_data_raw-input","DT_stats.Rds")))
DT_hist <- reactiveVal(readRDS(file=here::here("100_data_raw-input","DT_hist.Rds")))
DT_myShares <- reactiveVal(readRDS(file=here::here("100_data_raw-input","DT_myShares.Rds")))
DT_realTime <- reactiveVal(data.frame())- Reactive Endpoints
- The
outputobjects are the examples of reactive endpoints - As per the Rstudio documentation Observers are an implementation of Reactive endpoints. They can access reactive sources and reactive expressions, and they don’t return a value; they are used for their side effects
- In my app, I have used them extensively to perform on-click events like loading of data using the
observeEventfunction
- The
observeEvent(input$ab_loadFreshData,{
      fnHelper_shinyBusy(T,text = "Data Loading in Progress")
      #Get symbols from the CSV file
      infile <- input$file_yahooCodes
      DT_yahooCodes <- fread(file=infile$datapath)

      DT_stats_temp <- fn_getData_DTStats(DT_yahooCodes)
      DT_stats(DT_stats_temp) #assign value to the reactiveVal
      fnHelper_shinyBusy(F,session=session) # remove it when done
})- And also using the
observefunction for rendering the output ie when the side effect was desired
observe({
  output$boxEagle_additionalParameters <- renderUI({
    validate(need(DT_stats()$category,"Data is not loaded, please load data using the Data Processing Page"))
    box(collapsible = T,solidHeader = T,width = NULL,status = "info",title = "Additional Parameters"
        ,radioButtons("radioEagle_selectCategory",label = "Category",choices = unique(DT_stats()$category))
        ,selectInput("lovEagle_selectCountry",label = "Country",choices = c('ALL',unique(DT_stats()$country)))
        ,selectInput("lovEagle_selectSector",label = "Sector",choices = c('ALL',unique(DT_stats()$sector)))
        ,radioButtons("radioEagle_displayPerPage",label="Display per page"
                      ,choices = c(5,10,20,"ALL"),inline = T,selected= "10")
      )
    })
})- Reactive Conductors
- The reactive expressions created using the functions
reactiveorreactiveEventare the examples of Reactive conductors - As per the RStudio documentation, they are useful for caching the results of any procedure that happens in response to the user input like database or file access or for performing slow and expensive operations
- I have not used them in my app, but I could have used them for the data loading tasks
- I have achieve the same result by using
observeEvent/reactiveValDT_stats(DT_stats_temp) #DT_stats being the reactiveVal object- As per the help file the reactiveVal returns a function and Call the function with no arguments to (reactively) read the value; call the function with a single argument to set the value
- Maybe at a later stage, I will refactor the code and separate the
actionof loading the data from theside effectof displaying the user notification popup
- The reactive expressions created using the functions
Shiny Dev Con - Joe Cheng
I learnt a lot from this tutorial conducted by Joe Cheng. Below are some of key points directly from his video
Most notably the difference between
reactive()observe()Callable Not callable Returns a value No return value Lazy Eager Cached N/A reactive()observe()Purpose Calculations Actions Side effects? Forbidden Allowed reactive()is for calculating values, without side effects- A calculation is a block of code where you don’t care about whether the code actually executes—you just want the answer
- Safe for caching
observe()is for performing actions, with side effects- An action is where you care very much that the code executes, and there is no answer (return value), only side effects
What if you want both an answer AND you want the code to execute? Refactor into two code chunks–separate the calculation from the action
- We’ve identified several cases where we should use a reactive expression instead of an
observe(Event)/reactiveValuespairing. But there are cases where you simply must use the latter.- There are essentially cases where inputs, outputs, and reactive expressions aren’t powerful enough to natively express the computations you want to perform.
- So you have the “escape hatch” of
observe/reactiveValues; you can do things that would otherwise be impossible, at the price of your code being harder to reason about and harder for the reactive framework to help you with :
- Accumulating values over time, not just reacting to the latest one
- Aggregating multiple reactive values/expressions into a single expression
- Adding artificial latency into reactive values/expressions
- In general, we want to stick to reactive expressions whenever possible. And when we really need to, break out the big guns of
observe(Event)/reactiveValues.
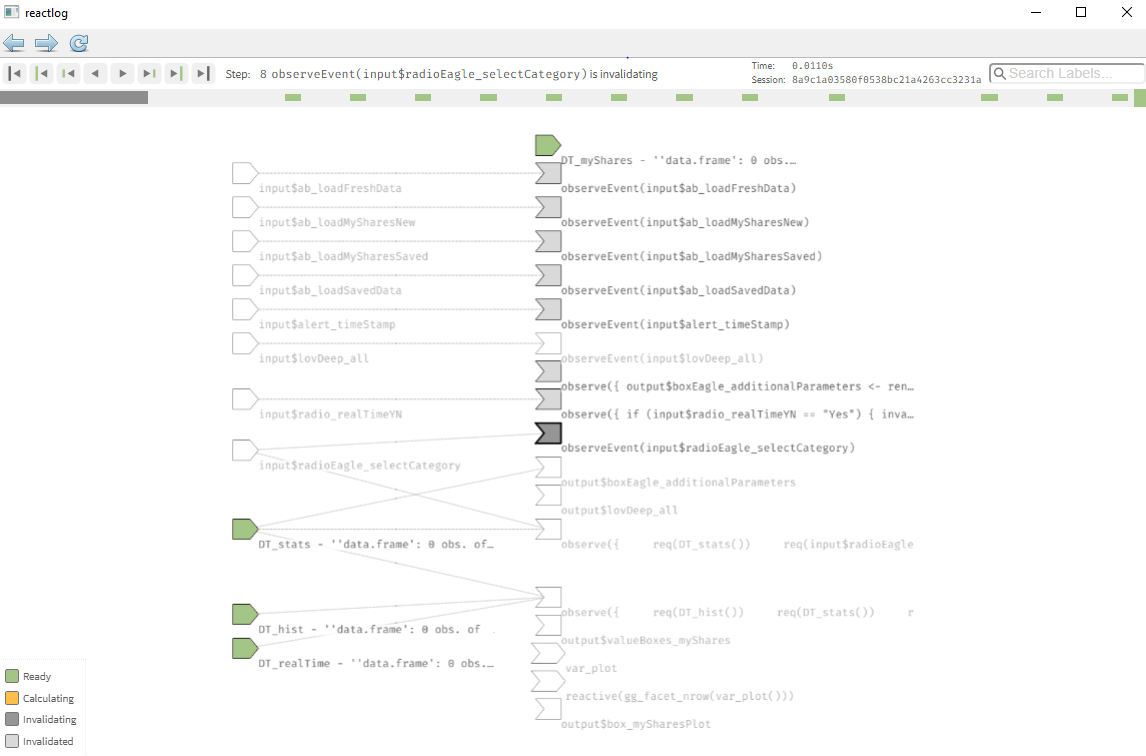
Reactive Log Visualizer
- If you want to see what is going on behind the scene of a Shiny app, then this is a cool option
- The lifecycle of the app is visualised using graphs that show the reactive inputs, outputs and expressions.
- I have not explored it much but I think it will be very useful in debugging performance issues in large complex apps
- It can be enabled by setting this option in the console
options(shiny.reactlog=TRUE) - And then run the app and press CTRL/CMD + F3
- On my Windows 10 machine I also had to set this option
options(useFancyQuotes = FALSE) - More details are available in this article
Invalidation, isolate to get real time data
- The reactive expressions and observers can get invalidated and when that happens their associated code needs to get re-executed
- One example is when the user clicks out of a tab, the output objects on that tab go out of focus and then Shiny invalidates the objects
- We can force shiny to invalidate an object after a certain interval by placing the
invalidateLaterfunction inside it - We also need to
isolatethe DT_realTime reactiveVal, otherwise shiny will keep invalidating it- If we do not then the code keeps getting executed again and again
- What
isolatedoes it that it executes the given expression in a scope where reactive values or expression can be read, but they cannot cause the reactive scope of the caller to be re-evaluated when they change
- I have used this functionailty to get live prices from Yahoo!
observe({
    if(input$radio_realTimeYN=="Yes"){
      # Re-execute this observer after n milliseconds
      invalidateLater(input$slider_realTimeDelay*1000)
      # The isolate() makes this observer _not_ get invalidated and re-executed when DT_realTime() changes
      isolate({
        DT_realTime(rbind(DT_realTime(),fn_getData_DTrealTime(DT_stats())))
      })
    }
  })
Dynamic Box heights
- I have enclosed the plots inside
shinydashboard::boxand I wanted to dynamically resize the heights of these boxes based on the heights of the plots that it contained - The
gg_facet_nrowfunction that I copied from Stackoverflow helped me in achieving that
#Dynamic height plot inside a box
var_plot <- reactive({
    fn_plotRealTime(DT_realTime=DT_realTime()
                    ,varSymbols=NULL
                    ,DT_myShares=DT_myShares())
})

var_dynamicHeight <- reactive(gg_facet_nrow(var_plot()))

output$box_mySharesPlot <- renderUI({
  req(DT_myShares()$symbol)
  box(collapsible = T,solidHeader = T,width = NULL,status = "info",title ="My Shares"
      ,renderPlot({ var_plot() },height = function(){var_dynamicHeight()*FACET_ROW_HEIGHT}))
  })

gg_facet_nrow <- function(p){
    assertive.types::assert_is_any_of(p, 'ggplot')
    p %>%
        ggplot2::ggplot_build() %>%
        magrittr::extract2('layout') %>%
        magrittr::extract2('layout') %>%
        magrittr::extract2('ROW') %>%
        unique() %>%
        length()
}
Summary
I am still working on this project and I will continue to update this blog as and when I make significant changes. For any questions/comments or collaboration on the project please reach out to me