- Book Table of Contents
- Chapters 1 - 4
- Chapter 5: Data Visualization
- Chapter 6: Decision Trees
- Chapter 7: Regression Models
- Chapter 8: Artificial Neural Networks
- Chapter 9: Cluster Analysis
- Chapter 10: Association Rule Mining
- Chapter 11: Text Mining
- Chapter 12: Naïve Bayes Analysis
- Chapter 15: Social Network Analysis
- Chapter 16: Big Data
- Chapter 18: Statistics Primer
- Chapter 19: Artificial Intelligence Primer
- Chapter 20: Data Science Careers
 Photo by Daria Nepriakhina on Unsplash
Data Analytics Made Accessible: 2018 edition by Anil Maheshwari is a quick and concise introduction to the Data Analysis world. Its neatly divided into 4 sections :
- Data Processing
- Core Data Mining techniques, including Data visualisation
- Advanced techniques like Text Mining, Web Mining
- Last section has Big data concepts and some primers on Data modeling, Stats and AI
The book doesn’t go into the details but in my opinion is a good high level overview. This post has the notes that I had highlighted from the book and are directly quoted from the book (for my future personal reference)
Book Table of Contents
- Chapter 1: Wholeness of Data Analytics
- Chapter 2: Business Intelligence Concepts & Applications
- Chapter 3: Data Warehousing
- Chapter 4: Data Mining
- Chapter 5: Data Visualization
- Chapter 6: Decision Trees
- Chapter 7: Regression Models
- Chapter 8: Artificial Neural Networks
- Chapter 9: Cluster Analysis
- Chapter 10: Association Rule Mining
- Chapter 11: Text Mining
- Chapter 12: Naïve Bayes Analysis
- Chapter 13: Support Vector Machines
- Chapter 14: Web Mining
- Chapter 15: Social Network Analysis
- Chapter 16: Big Data
- Chapter 17: Data Modeling Primer
- Chapter 18: Statistics Primer
- Chapter 19: Artificial Intelligence Primer
- Chapter 20: Data Science Careers
Chapters 1 - 4
- Data mining should be done to solve high- priority, high- value problems.
- It is said that 70% of all data mining work is about classification solutions; and that 70% of all classification work uses decision trees.
- An analysis of items frequently found together in a market basket can help cross- sell products, and also create product bundles.
- A skilled and experienced BI specialist should be open enough to go outside the box, open the aperture and see a wider perspective that includes more dimensions and variables, in order to find important patterns and insights. The problem needs to be looked at from a wider perspective to consider many more angles that may not be immediately obvious. An imaginative solution should be proposed for the problem so that interesting and useful results can emerge.
- The problem should be valuable enough that solving it would be worth the time and expense.
- The top- down approach is to make a comprehensive DW that covers all the reporting needs of the enterprise. The bottom- up approach is to produce small data marts, for the reporting needs of different departments or functions, as needed.
- The difference between a star and snowflake is that in the latter, the look- up tables can have their own further look up tables.
- Only the data that suits the nature of the problem being solved should be gathered. The data elements should be relevant, and suitably address the problem being solved. They could directly impact the problem, or they could be a suitable proxy for the effect being measured.
- For example, total costs of health care and the total number of patients may need to be reduced to cost/ patient to allow comparability of that value.
- A tool could be tried with different options, such as running different decision tree algorithms.
- A good goal would be one that would deliver a good ROI to the organization.
- Examine the data with a critical eye and do not naively believe everything you are told about the data.
- Don’t make erroneous assumptions, courtesy of experts. Don’t rule out anything when observing data analysis results. Don’t ignore suspicious (good or bad) findings and quickly move on.
- Even when insights emerge at one level, it is important to slice and dice the data at other levels to see if more powerful insights can be extracted.
- Diving into the data at the right angle can yield insights at many levels of data.
Chapter 5: Data Visualization
- The presentation should aim to highlight the insights from the data in an actionable manner. If the data is presented in too much detail, then the consumer of that data might lose interest and the insight.
- Show, and even reveal, the data: The data should tell a story, especially a story hidden in large masses of data. However, reveal the data in context, so the story is correctly told.
- Induce the viewer to think of the substance of the data: The format of the graph should be so natural to the data, that it hides itself and lets data shine.
- Make large data sets coherent: By giving shape to data, visualizations can help bring the data together to tell a comprehensive story.
- Encourage the eyes to compare different pieces of data: Organize the chart in ways the eyes would naturally move to derive insights from the graph.
- Serve a reasonably clear purpose– informing or decision- making.
- Each mode should tell a complete story. Intersperse text with the map/ graphic to highlight the main insights.
- Context is important in interpreting graphics. Perception of the chart is as important as the actual charts. Do not ignore the intelligence or the biases of the reader. Keep the template consistent, and only show variations in data.
- Quality of information transmission comes prior to aesthetics of chart. Leaving out the contextual data can be misleading.
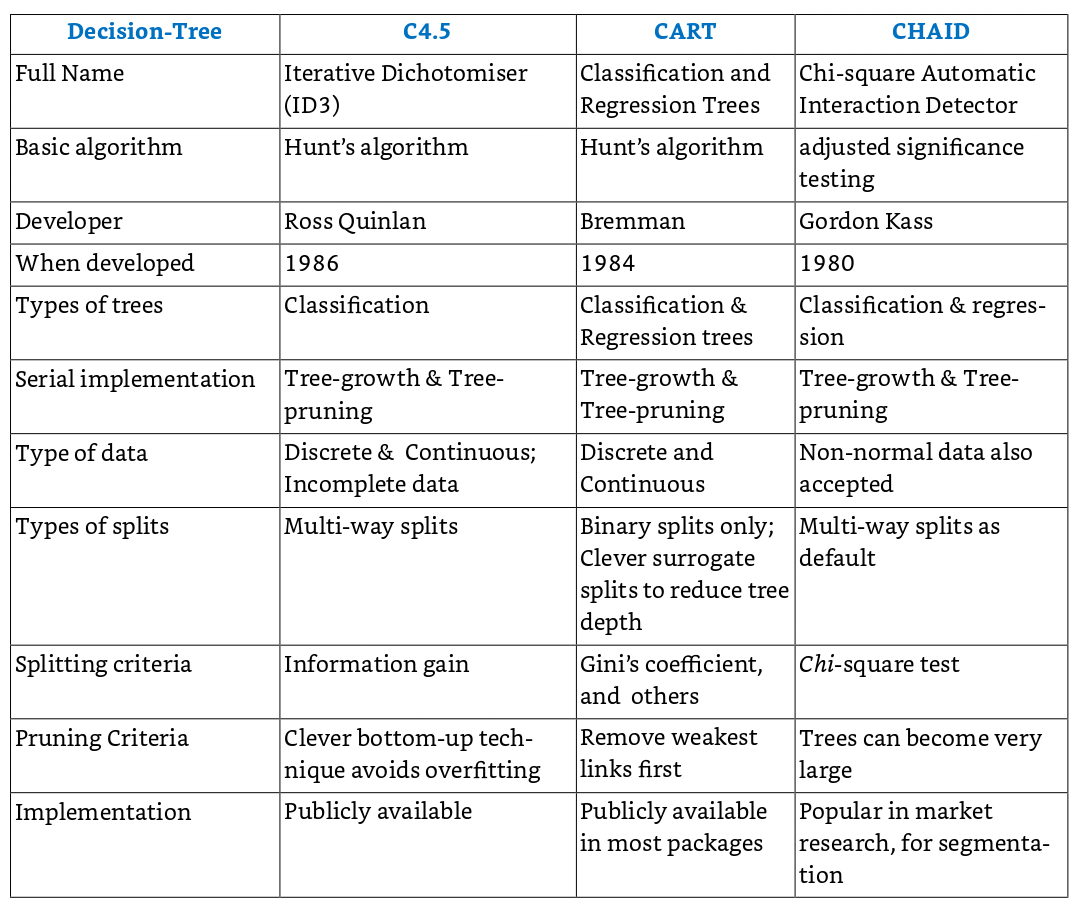
Chapter 6: Decision Trees
- Decision trees are one of the most widely used techniques for classification.
- The more variables the tree can choose from, the greater is the likely of the accuracy of the decision tree.
- This tree is almost symmetric with all branches being of almost similar lengths. However, in real life situations, some of the branches may be much longer than the others, and the tree may need to be pruned to make it more balanced and usable.
- When multiple candidate trees are available, one could choose whichever is easier to understand, communicate or implement.
- Algorithms use different measures like least errors, information gain, Gini’s coefficient, etc to compute the splitting variable the provides the most benefit.
- Information gain is a mathematical construct to compute the reduction in information entropy from a prior state to the next state that takes some information as given. The greater the reduction in entropy, the better it is.
- The most popular decision tree algorithms are C5, CART and CHAID (Table)
Chapter 7: Regression Models
- Regression is a well- known statistical technique to model the predictive relationship between several independent variables (DVs) and one dependent variable.
- It shows the co- efficient of correlation of this regression model is 0.984. R2, the total variance explained by the equation, is 0.968 or 97%.
- Logistical regression models use probability scores as the predicted values of the dependent variable. Logistic regression takes the natural logarithm of the probability of the dependent variable being a case (referred to as the logit function), and creates a continuous criterion as a transformed version of the dependent variable. Thus the logit transformation is used in logistic regression as the dependent variable.
- The strength (or the goodness of fit) of the regression model is measured in terms of the correlation coefficients, and other related statistical parameters that are well understood.
- Regression models can not cover for poor data quality issues. If the data is not prepared well to remove missing values, or is not well- behaved in terms of a normal distribution, the validity of the model suffers.
- Regression models work only with numeric data and not with categorical variables. There are ways to deal with categorical variables though by creating multiple new variables with a yes/ no value.
Chapter 8: Artificial Neural Networks
- Their intermediate synaptic parameter values evolve as the system obtains feedback on its predictions, and thus an ANN learns from more training data (Figure 8.1).
- ANN can deal with (identify/ model) highly nonlinear relationships on their own, without much work from the user or analyst.
- There is no need to program neural networks, as they learn from examples. They get better with use, without much programming effort.
- The presence of noise in the data makes the detection of the clusters even more difficult.
Chapter 9: Cluster Analysis
- The quality of a clustering result depends on the algorithm, the distance function, and the application. First, consider the distance function. Most cluster analysis methods use a distance measure to calculate the closeness between pairs of items. There are two major measures of distances: Euclidian distance (“ as the crow flies” or straight line) is the most intuitive measure. The other popular measure is the Manhattan (rectilinear) distance, where one can go only in orthogonal directions.
- The Euclidian distance is the hypotenuse of a right triangle, while the Manhattan distance is the sum of the two legs of the right triangle. There are other measures of distance like Jacquard distance (to measure similarity of sets), or Edit distance (similarity of texts), and others.
Chapter 10: Association Rule Mining
- An example of an association rule would be, “A Customer who bought a flight tickets and a hotel reservation also bought a rental car plan 60 percent of the time.”
- Association rules are created that meet the support level (> 33%) and confidence levels (> 50%).
- The strongest of rules, with the higher support and confidence rates, should be used first, and the others should be progressively implemented later.
- Association Rules help discover affinities between products in transactions. It helps make cross- selling recommendations much more targeted and effective. Apriori technique is the most popular technique, and it is a machine learning technique.
Chapter 11: Text Mining
- Term Document Matrix This is the heart of the structuring process. Free flowing text can be transformed into numeric data in a TDM, which can then be mined using regular data mining techniques.
Chapter 12: Naïve Bayes Analysis
- NB algorithm is easy to understand and works fast. It also performs well in multi class prediction, such as when the target class has multiple options beyond binary yes/ no classification. NB can perform well even in case of categorical input variables compared to numerical variable( s).
- compute prior probability. Suppose the data gathered for the last one year showed that during that period there were 2500 customers for R, and 1500 customers for M. Thus the default (or prior) probability for the next customer to be for R is 2500/ 4000 or 5/ 8.
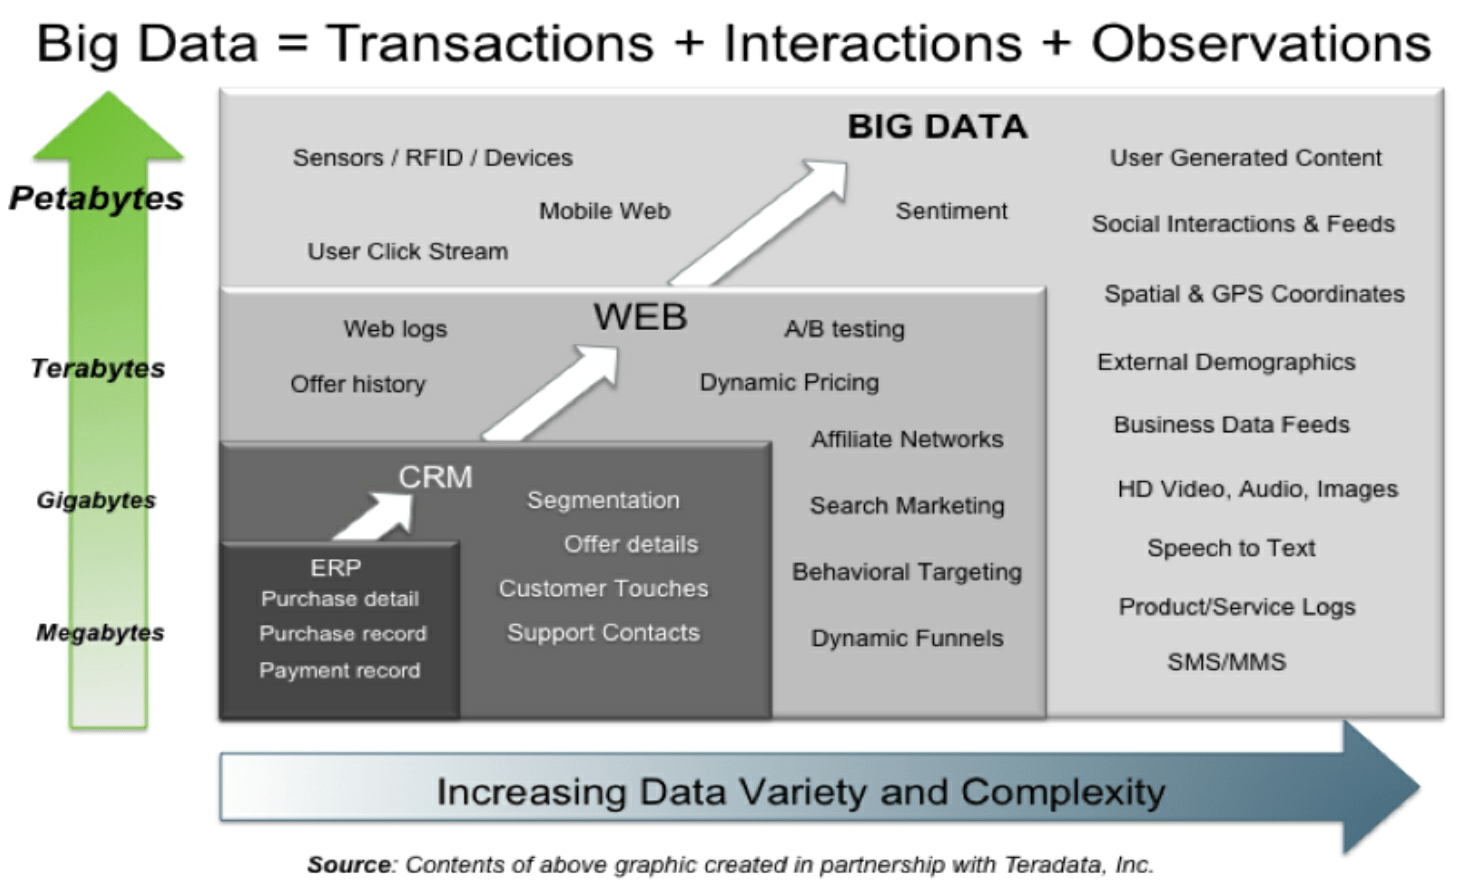
Chapter 16: Big Data
- Organizations need to figure out how to use big data as a strategic asset in real time, to identify opportunities, thwart threats, build new capabilities, and enhance operational efficiencies.
- Large non- relational databases like Hadoop have emerged as a leading data management platform for big data. In Hadoop’s Distributed File System (HDFS), data is stored as ‘key and data- value’ combinations. Google BigFile is another prominent technology. NoSQL is emerging as a popular language to access and manage non- relational databases.
- Spark: Developed by UC Berkeley’s AMP labs, this is a relatively very new way of processing big data that is 10x faster than the Hadoop system.
Chapter 18: Statistics Primer
- The confidence level is usually specified by its inverse, the chance or error, i.e. 1– α, where α is called the significance level, or simply the p- value. For a 95% confidence level, the p- value should be less than or equal to 0.05.
Chapter 19: Artificial Intelligence Primer
- Turing’s test for a computer was to engage in a conversation with a human being, such that the human being could not decipher whether he was conversing with a machine or a human being.
Chapter 20: Data Science Careers
- The data scientist finds bliss in immersing into the data, and finding patterns that ultimately align with the unified field of all the laws of nature.